Among the challenges in presenting a rich body of knowledge (like the one we are assembling on the history of Cuba 1952-1959) is how to present detailed information in ways that help avoid getting lost in detail and losing sight of the big picture. One of the ways we've exploring to address that challenge is software for visualizing event data as a graphical timeline.
We hope the Cuba 1952-1959 timeline will be useful to those interested in key events of that critical period in Cuban history, the big picture of those events, and a map to navigate to events and themes of greatest interest.
As a preview to give you a sense of what the Cuba 1952-1959 graphical timeline will look like, and to let you test drive the timeline viewer, we offer you the following sample timeline populated with events relevant to Cuban history of the last fifty years:
Cuba 1959-2009
To help get you started below is a brief guide to the timeline viewer software. The link to the 50 year sample Cuba 1959-2009 timeline will open in a new window, so this Quick Start Guide will still be open so you can easily refer to it when looking at the timeline.
Timeline Viewer Quick Start Guide
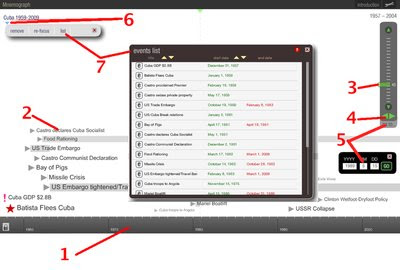
Below is a picture of timeline viewer interface, with notes summarizing its major features (numbered in red in the picture).

1 Calendar time bar is at bottom of window, its scale can be changed with Zoom control (3).
2 Events: each positioned so its icon lines up horizontally with its date on the calendar time bar. The span of events that take place over more than a day is shown by a shaded bar. Mouse over any event to see its date(s), click on any event to see more information about it.
3 Zoom control: click and drag slider, moving it up and down to set the time bar scale desired. Moving the slider upwards zooms in, for more detailed view, shrinking time scale view (less time visible). Moving the slider down zooms out giving a more general view with less detail and expanding the time scale so more calendar time is visible on screen. When zooming out, some detail is lost, not all events are visible when zooming out to very large time scale. If you reload the page you will restart at the original zoom level.
4 Time Navigation arrows: click on these to move forward (right) or backward (left) in time.
5 Clicking on Go To opens up a window where you can enter a date to center on the timeline bar. This is especially helpful if you have Zoom control set to scale where all the events on the timeline are not visible in the window, or if you want to navigate to distant date.
6 Clicking on the small triangle under the title pops up a set of buttons, one is list
7 Clicking on list opens up a window with list of events in the timeline. This is especially helpful if you have the Zoom control set to a scale where not all event titles are visible in the window. Like other popup windows, this can be closed by clicking on the X in the upper right corner of the window.
The software used to create the timeline is Mnemograph. Though still in beta, those of you are who are teachers or work with large sets of time-coded data may find it worthwhile to consider it as a data visualization tool.


 Mobile subscription


1 comment:
Magnífico proyecto. Les ruego me mantengan al tanto en eltonodelavoz@gmail.com
Un abrazo,
Jorge Ferrer
Post a Comment